In 2026, the biggest “wait, what?” moment we see with brain age tools is that many people’s brain appears to change in ways that do not match what they feel day to day, and that mismatch can show up fast. And that is exactly why Structural vs functional brain age: what your data reveals matters, because your measurements can tell different stories depending on what kind of “age” they’re tracking.
| What you measure | What it usually means | How to act in 2026 |
|---|---|---|
| Structural brain age (gray matter, volume) | More about “hardware” and long-term aging patterns | Use baselines and track change with brain-volume style markers, like the hippocampus references in our brain volume and hippocampal atrophy reference chart |
| Functional brain age (network connectivity, activation) | More about “software,” how efficiently networks work right now | Pair cognitive or rehab tasks with objective follow-ups, not guesses |
| Gap patterns (structure older, function younger, or vice versa) | A clue to what’s driving your risk or resilience | Match your plan to the gap, and treat consistency like part of the dosage |
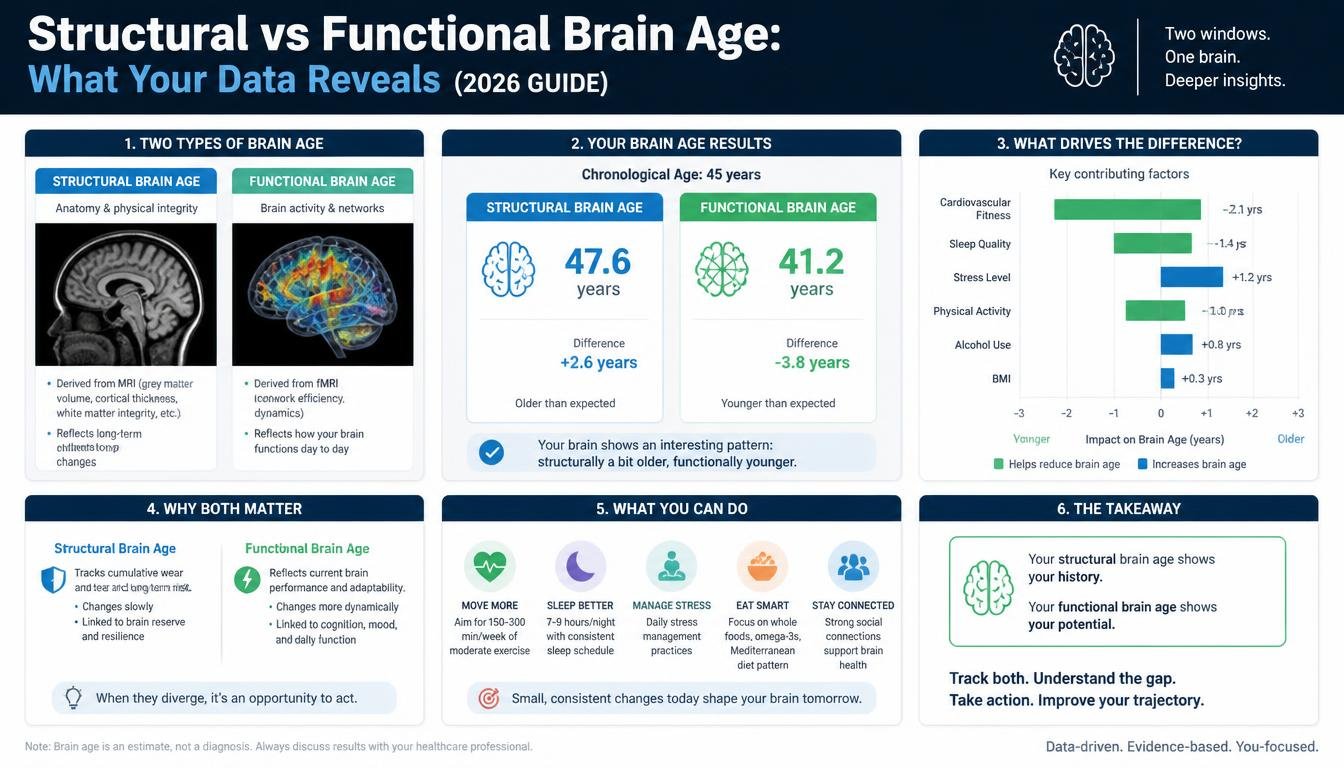
When people say Structural vs functional brain age: what your data reveals, they usually mean two different “aging lenses.” Structural brain age focuses on physical brain characteristics (think tissue volume and gray matter patterns). Functional brain age focuses on how brain networks operate (how connectivity and activation patterns work during rest or tasks).
In 2026, this is especially relevant because more “brain age” reports, modeling tools, and rehab dashboards are becoming common in wellness and clinical-adjacent settings. But the value depends on how you interpret the mismatch between the two lenses. A person can look “older” structurally while functioning relatively well, or the reverse.
Here is the quick way we explain it to clients and partners:
And compensation is where brain age gets interesting for practical planning, because networks can often reorganize faster than the underlying tissue can fully remodel.

Structural brain age is often anchored in measurements like brain volume and hippocampal-related atrophy patterns. The practical takeaway in Structural vs functional brain age: what your data reveals is that structural markers can reflect longer-term risk, even when day-to-day performance seems stable.
This is why we like frameworks that help people understand what normal variability looks like. Our brain volume and hippocampal atrophy reference chart is designed for that baseline thinking, especially around the medial temporal lobe and memory-relevant structures.
When structural brain age looks accelerated, we usually avoid two traps:
In 2026, the better approach is to treat structure as your “starting point,” then build a plan that targets the circuits you need to support. We do that by pairing structured practice with attention, sleep, and aerobic movement that supports neuroplastic change.
Functional brain age is often about network efficiency, connectivity patterns, and how the brain responds during tasks. In Structural vs functional brain age: what your data reveals, functional measures can explain why someone performs well or poorly even when structural markers look less favorable.
We also think functional data is where modern rehab planning gets most actionable. In 2026, the “best for” rehab mindset is not just doing more activities, it is dosing the right kind of practice and measuring changes over time.
That is the same logic behind how we evaluate neuroplasticity treatment plans:
If your functional brain age looks “younger” than your structural brain age, that often suggests compensation is working. If it looks “older,” it suggests you may need tighter control of training intensity, attention load, and recovery time.
Now for the part people actually care about: the gap. Structural vs functional brain age: what your data reveals is not just “which one is older,” it is also “what does the mismatch imply about your biology and your capacity to adapt.”
Here are common gap patterns we see in coaching conversations, and how we interpret them in 2026 planning:
| Gap pattern | What it can suggest | What we do next |
|---|---|---|
| Structure older, function relatively better | Compensation may be working, or training habits support function | Keep functional training, add consistent aerobic movement, and protect sleep and attention |
| Function older, structure relatively preserved | Networks may be overtaxed, undertrained, or recovering poorly | Lower cognitive load strategically, increase task-specific practice dosing, and track follow-ups |
| Both older | Higher overall aging pressure or reduced capacity for adaptation | Use a full-spectrum neuroplasticity plan with measurable baselines (structure and function both matter) |
And yes, epigenetic “brain age” and brain age gap reports can also appear in this conversation. Our epigenetic brain clocks, brain age vs birth age guide frames why a gap can show up before symptoms. That matters because it encourages earlier structure in your neuroplasticity plan.
Even if you get a structural vs functional comparison, Structural vs functional brain age: what your data reveals only becomes useful when you turn it into a training plan. In 2026, we favor a “measured baselines” approach because it reduces guessing and helps you adjust dosing.
Our working method looks like this:
That same framework shows up in our “best for” rehab planning resources. For example, our how to choose the right stroke rehab program in 2026 explicitly calls out functional vs structural plasticity, measured baselines, and correct dosing of practice.
If you want the short version, here it is: functional measures guide what you practice, structural measures help you understand why your progress may need more time or more consistency.

Researchers analysed 27,793 brains to compare structural and functional ageing patterns.
This is where the conversation often gets blended with supplements and audio tools, so we keep it grounded. Structural vs functional brain age: what your data reveals can tell us whether you’re in a state where your brain benefits from synaptic support, attention priming, and better recovery pacing. That is why BDNF comes up so often in our planning.
We also want to address your secondary search angles directly:
In our content, BDNF is treated as a central target in recovery planning (for example, in neurological recovery in 2026). Brainwave-style supports are discussed as priming layers, not replacements for structured practice.
If you want a practical starting point in 2026, we suggest combining:
And if you’re also exploring at-home tools, we cover BDNF-targeted audio training at home in our top home-based neuroplasticity tools for stroke survivors (best picks for 2026).
When structural vs functional brain age doesn’t feel straightforward, predictive modeling can help you think in “trajectories” instead of single numbers. Our guides on neural digital twins describe these tools as dynamic computational models built from multimodal data to simulate recovery trajectories and treatment response.
In 2026, we treat neural digital twins as decision support, not a replacement for clinician judgment. That framing matters for Structural vs functional brain age: what your data reveals, because you want recommendations that account for real recovery variance.
For rehab settings, two practical entry points are:
If you want Structural vs functional brain age: what your data reveals in a real plan, stroke recovery is one of the clearest use cases because clinicians constantly balance structure and function during rehab.
In 2026, our approach emphasizes dosing and repetition, then uses objective progress tracking to show whether training is improving function. This is also where BDNF-targeted strategies show up as “priming” for better synaptic strengthening.
Here are a few relevant “best for” reads we recommend for thinking about structural vs functional change:
We also like to include images where they help people visualize the plan type. For instance, stroke and neuroplasticity training visuals are covered in our exercise-focused guide, and you can pair that with a longer longevity plan for attention and recovery support.
And circling back to your secondary angle, people often ask whether “manifestation manifestation techniques BDNF BrainWave boost brain power naturally” can matter. We don’t treat it as a substitute for training, but we do treat intention, attention focus, and consistency as part of the systems that help people stay with the plan long enough for function to improve. If you want to support your “brainwave boost” routine, the best results usually come when it’s paired with repetition-based practice and a recovery schedule.
If you receive any kind of brain age data, including structural vs functional comparisons, we recommend a simple interpretation checklist. This keeps your next step grounded in evidence-based planning and helps you avoid overreacting to a single number.
Use this checklist for Structural vs functional brain age: what your data reveals:
And if your plan includes anything like manifestation manifestation techniques BDNF BrainWave boost brain power naturally, we suggest keeping it tied to measurable behavior changes, like improved task performance, better attention stability, or safer motor practice quality.
Structural vs functional brain age: what your data reveals is only powerful when we treat structure and function as two complementary stories. In 2026, the gap between them can guide how we dose training, how we prime BDNF-related readiness, and how we track real change instead of relying on a single biomarker-style estimate.
So if your data feels mismatched, don’t panic. Use that mismatch as a map, start with functional-first planning, and build a consistent, measurable neuroplasticity routine that supports both how your brain works today and how it adapts over time.
Structural vs functional brain age: what your data reveals usually compares physical brain markers (like volume patterns) with how brain networks function (like connectivity or activation). Structural age can reflect longer-term aging pressure, while functional age can show faster compensations or inefficiencies.
Yes, that pattern can happen, and it often means compensation is working or your daily habits are supporting network efficiency. In Structural vs functional brain age: what your data reveals, the gap becomes actionable because you can focus training on the functional targets that need support.
In 2026, evaluated brain age prediction software packages have shown limited clinical utility as biomarkers, so we treat brain age as decision support. The best use of Structural vs functional brain age: what your data reveals is to guide measured, follow-up-based neuroplasticity planning.
We use BDNF-focused strategies and brainwave-style priming as support for better training readiness, not as replacements for task-specific practice. If you are into manifestation manifestation techniques BDNF BrainWave boost brain power naturally, we recommend tying those routines to measurable changes in attention, recovery, and task performance.
Start by translating the gap into an action plan with baselines and follow-ups, not panic decisions. Our approach in Structural vs functional brain age: what your data reveals is to map your measurements to practical targets, then dose the training that improves function.
No single marker perfectly predicts outcomes, and brain aging often shows up as patterns rather than guarantees. That’s why Structural vs functional brain age: what your data reveals works best when you combine structure and function and track whether memory and attention actually improve with your plan.